Churches in the Diocese of Oxford continue to make strides towards recovery following the Covid-19 lockdowns.
Church attendance can't tell the whole story, but the numbers can tell us quite a lot. With figures from October 2023 showing a strong return to 84% of the 2019 attendance level - a further increase on the 81% seen in 2022 - what does this mean for the year ahead, and how can churches continue to build on this momentum?
Dr Bev Botting (Data Analyst, Diocese of Oxford, with support from Dr Ken Eames (Senior Statistical Researcher, Church of England) and Ven Bob Jackson (Church Growth Consultant), have compiled a report for the Diocese of Oxford comparing church attendance in October 2023 with 2022 and 2019.
Jump to: Summary | Background | Responses | Recovery | Attendance | Recommendations
1. Summary
- Attendance recovery from covid lockdown has continued into 2023, and by October 2023 was at 84% of the 2019 level, a further increase on the 81% seen in 2022.
- The recovery to October 2023 compared with October 2022 represents an average of an extra 3 people attending each church each week.
- Recovery has been weaker among children than it has been among adults. In contrast, attendance at school services in 2023 was higher than in 2019.
- The smallest churches are the only size group to have recovered back to their 2019 attendance level.
- Churches that have maintained or increased the number of services they offer have largely recovered to their 2019 attendance levels. But many churches have reduced the number of their services and one third now do not offer at least one Sunday service every week. These churches have a greater gap between their 2023 and 2019 average attendance levels.
- Significant new attendance growth in the coming year is still entirely possible, as proved by those churches that have grown their attendance since 2019. Among other things, new growth may need churches to plant new congregations.
2. Background to the report
The main purpose of this exercise was to compare attendance in October 2023 with 2022 and with the last ‘normal’ year of 2019, to see what could be learned about how church attendance has changed over this period, and to help understand how the churches could grow and develop in the future.
This report is a mix of objective statistical analysis and some recommendations that seem to flow from the analysis.
There has been no full return to the previous normal in society. Some behaviours have changed permanently – for example more people now work and shop from home. Online meetings and interactions are less frequent now than in lockdown but still a lot more common than beforehand. European wars, high inflation, a cost-of-living crisis and increasing energy prices provide a new context for church life.
So, what has been happening to church attendance in the Diocese of Oxford over the past five years, and what lessons can we learn for the future?
3. Response rate
For this study we have used data from 433 churches (54% of the 811 churches in the diocese) in the comparisons between 2019 and 2023, and 446 churches (55%) in the comparison between 2022 and 2023. This compares with 375 churches’ data included in the October 2022 analysis last year.
The total number of churches responding to our request for October 2023 data was even greater than this, but some data could not be included in this study as either they had not responded in 2019 or 2022 (so we could not compare their figures) or a church had included figures for another church in one of the years but not the other.
Finally, we excluded data from a few churches that had reported no attendance in either 2019 or 2022 but, knowing the churches, we believe it was unlikely they had no attendance during October. The original response rate to our request to complete their October 2023 figures earlier than usual was 65%. This is a magnificent achievement in such a tight time scale. We are very grateful to those involved in providing their church’s data. This result also shows the practicality of collecting and analysing any ‘Statistics for Mission’ data in a short time-period in the future.
An analysis of our previous early October 2022 analysis, Post-Covid-19 Trends, Patterns and Possibilities, compared with the final figures published by the national church in November 2023, showed that our early analysis of change in average weekly attendance (AWA) between 2019 and 2022 had been within one percent of the final figure. Therefore, we can have confidence in the methodology behind our early October analysis, especially as for 2023 it is based on more churches than were used in 2022. This year we have a high response rate, and we cannot see any biased pattern in the churches not responding, so we have confidence that our sample is representative of the whole diocese. Of course, when the full figures are published in late 2024, they may show slightly different patterns.
4. Does attendance matter?
The mission of the Christian church is not so much to attract crowds to worship events as to make disciples and serve the Kingdom. But how do we know if we are fulfilling our mission effectively? Counting attendance is one important pointer, an indicator of the numerical size of the Body of Christ. It helps monitor our success in holding and making disciples. It can show where we are making and where we are losing disciples. It can inform and challenge churches and dioceses about how we go about our mission in the future. Church attendance numbers do not tell us everything, but they can tell us quite a lot.
5. Has recovery continued through 2023?
Click each graph to view at full size.
Recovery has continued. Combining data for our diocese from 2022 Statistics for Mission table with our estimates for October 2023 gives the following onsite all-age all-week (AWA) attendance estimates expressed as a percentage of their 2019 counterpart. The measure ‘Average weekly attendance figures are the average over the first four week of October, including weeks where the number is zero.
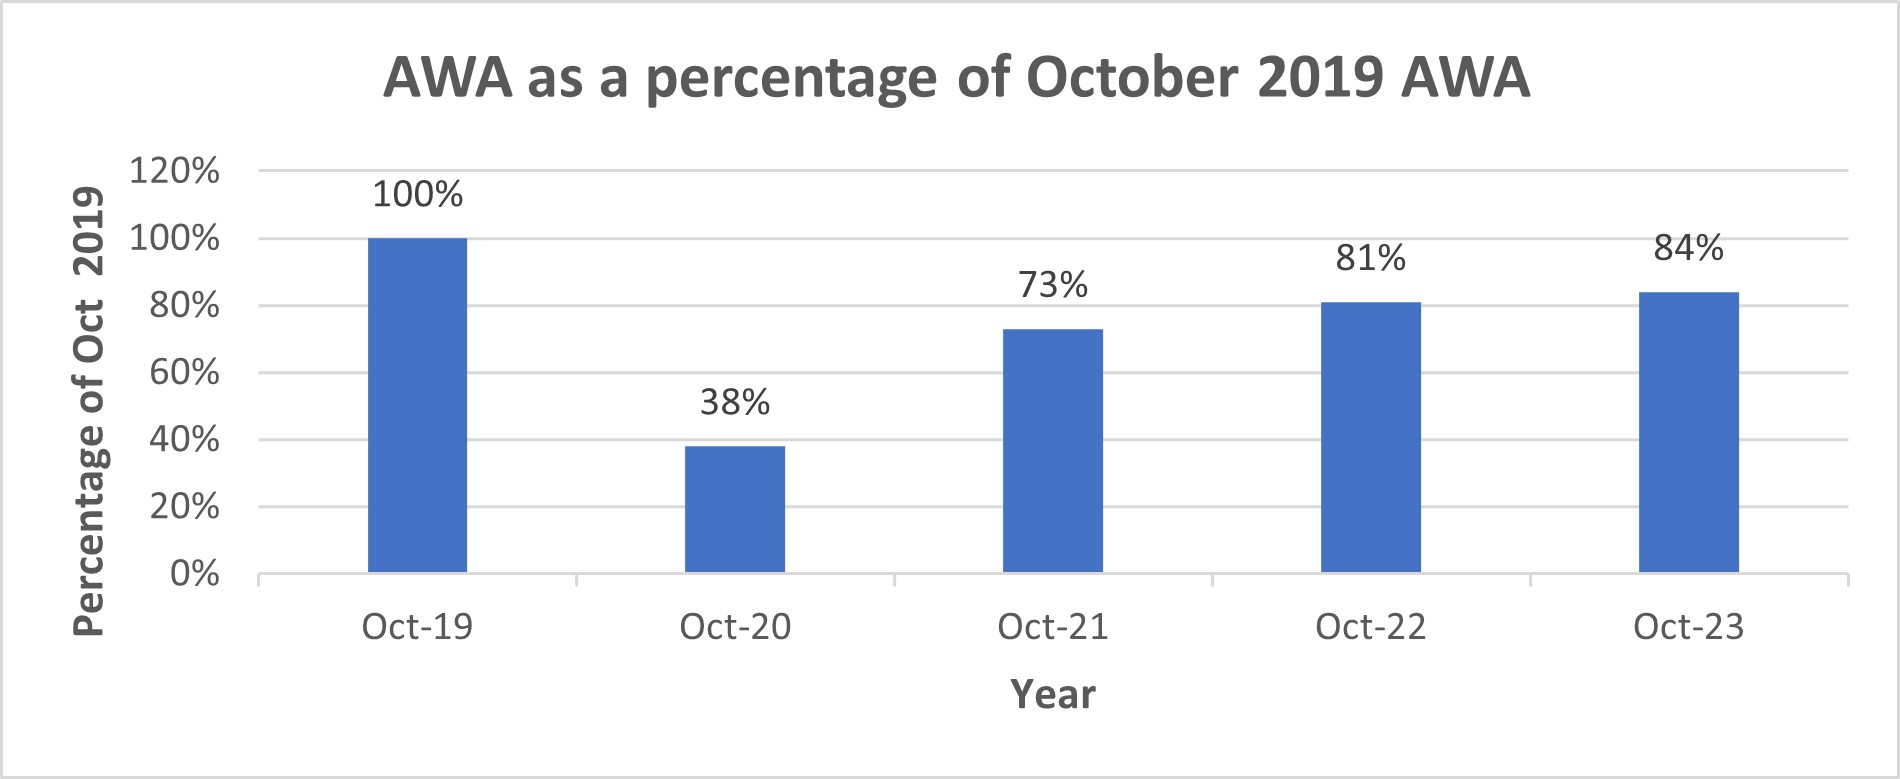
Overall recovery to October 2023 was 84% representing a fall of 16% from 2019 levels. However, this also represents a further recovery compared with October 2022 of 5.6%, or an average of an extra 3 people attending each church each week.
If this recovery, seen in our sample, was seen across all churches in our diocese, this would represent an additional 2,350 people in our churches each week,
Recovery to October 2023 in our sample of churches varied hugely by the size of church, number of services, and between adults and children.
Jump to: Summary | Background | Responses | Recovery | Attendance | Recommendations
6. How have the different components of attendance fared?
Size of church
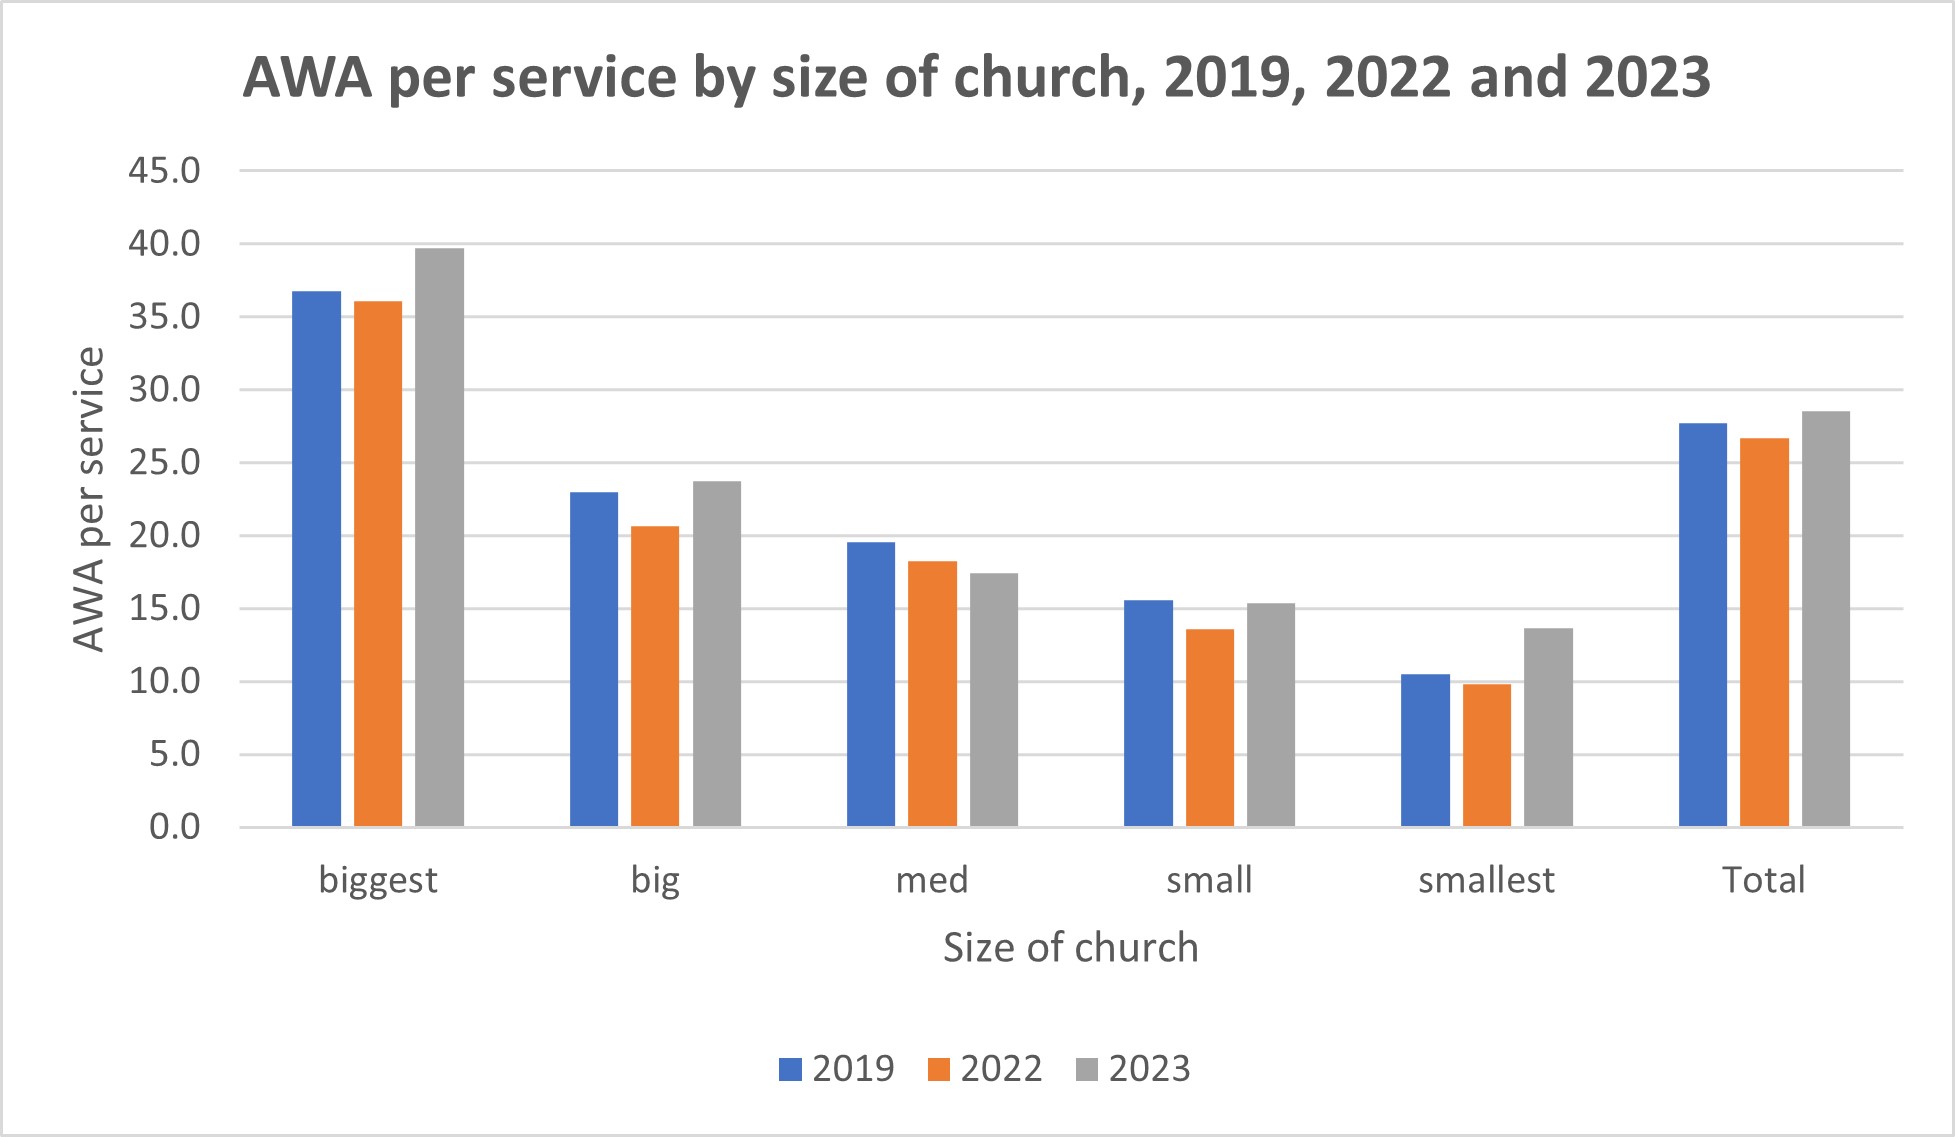
In this analysis we grouped churches by quintile of national AWA attendance in 2019 (Smallest 0-10, Small 10.25-22, Medium 23-46, Big 46.25-90, Biggest 91 +(of which in our diocesan sample 25 are over 200, and of these 4 are 300-500, 1 is 501-700 and 2 Oxford churches, St Ebbe’s and St Aldates, are over 1000).
Our previous report showed that the recovery varied by church size – the smaller the church, on average, the stronger the recovery. This continued to October 2023 as shown in the chart below. The biggest churches in 2019 on average had an AWA 24% lower in 2023 compared with 2019, whereas the smallest churches in 2019 were on average 49% larger. However, in part this is due to a statistical phenomenon known as ‘regression to the mean’ which means that the smallest churches can only stay the smallest or get larger, and the largest churches can only stay the largest or get smaller, whereas those in the middle categories could move in either direction.

A different picture is seen, however, when looking at the change between 2022 and 2023, when we see an increase in AWA for all sizes of church except those classed as ‘big’ which saw a small decrease.
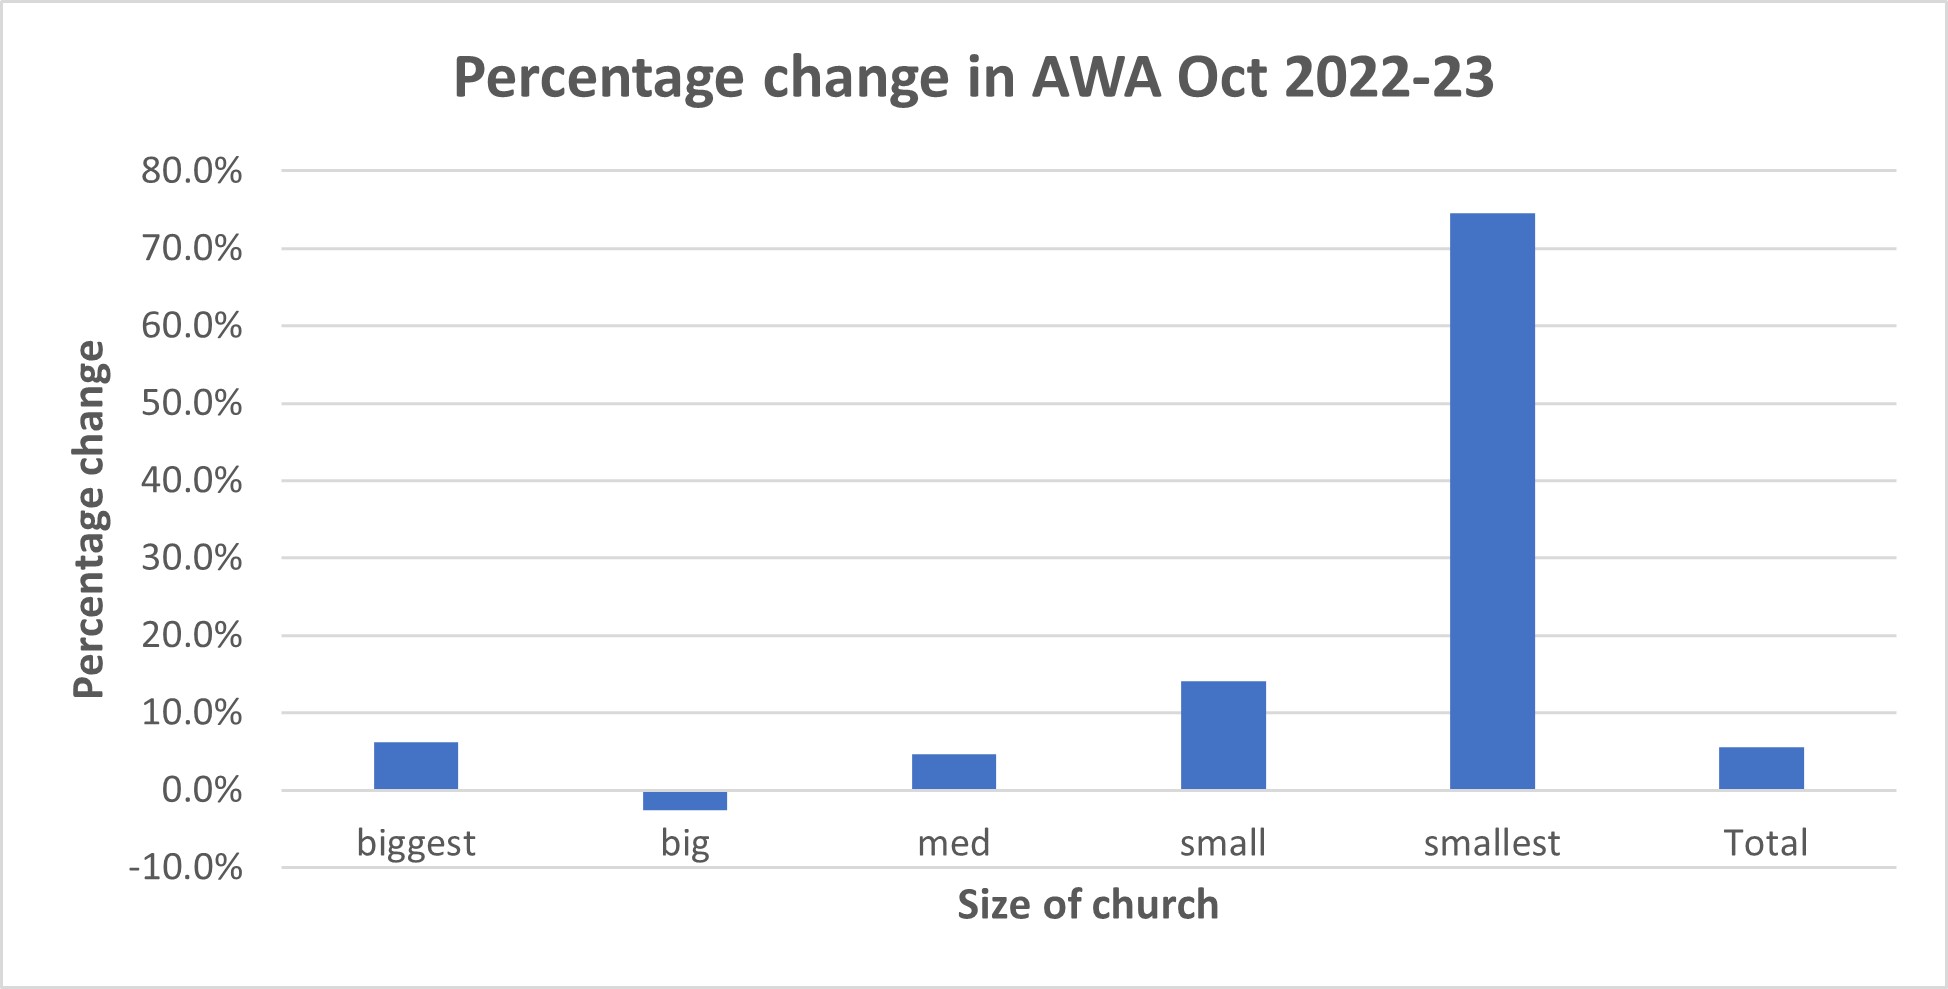
Overall, our churches saw an average of 3 people extra attending each church in 2023 compared to 2022. This may not be 3 people new to church; instead, it may be people coming to church more frequently each month, for example.
The biggest churches saw on average 9 extra people representing an increase in their AWA of 6% whereas our smallest churches saw an average increase of 3 people in each church representing an increase of 75%.Our smallest churches, however, tend to only have one service a fortnight, so this apparently high increase is due to a combination of both a small increase in average number of services in this group of smallest churches, and a modest increase in average attendance at each service.
Adults and children
Between 2019 and 2023 the AWA fell for both adults and children, by 14% for adults and 25% for children.
This fall in average attendance was seen in all sizes of church except the smallest which saw an increase for both adults and children.
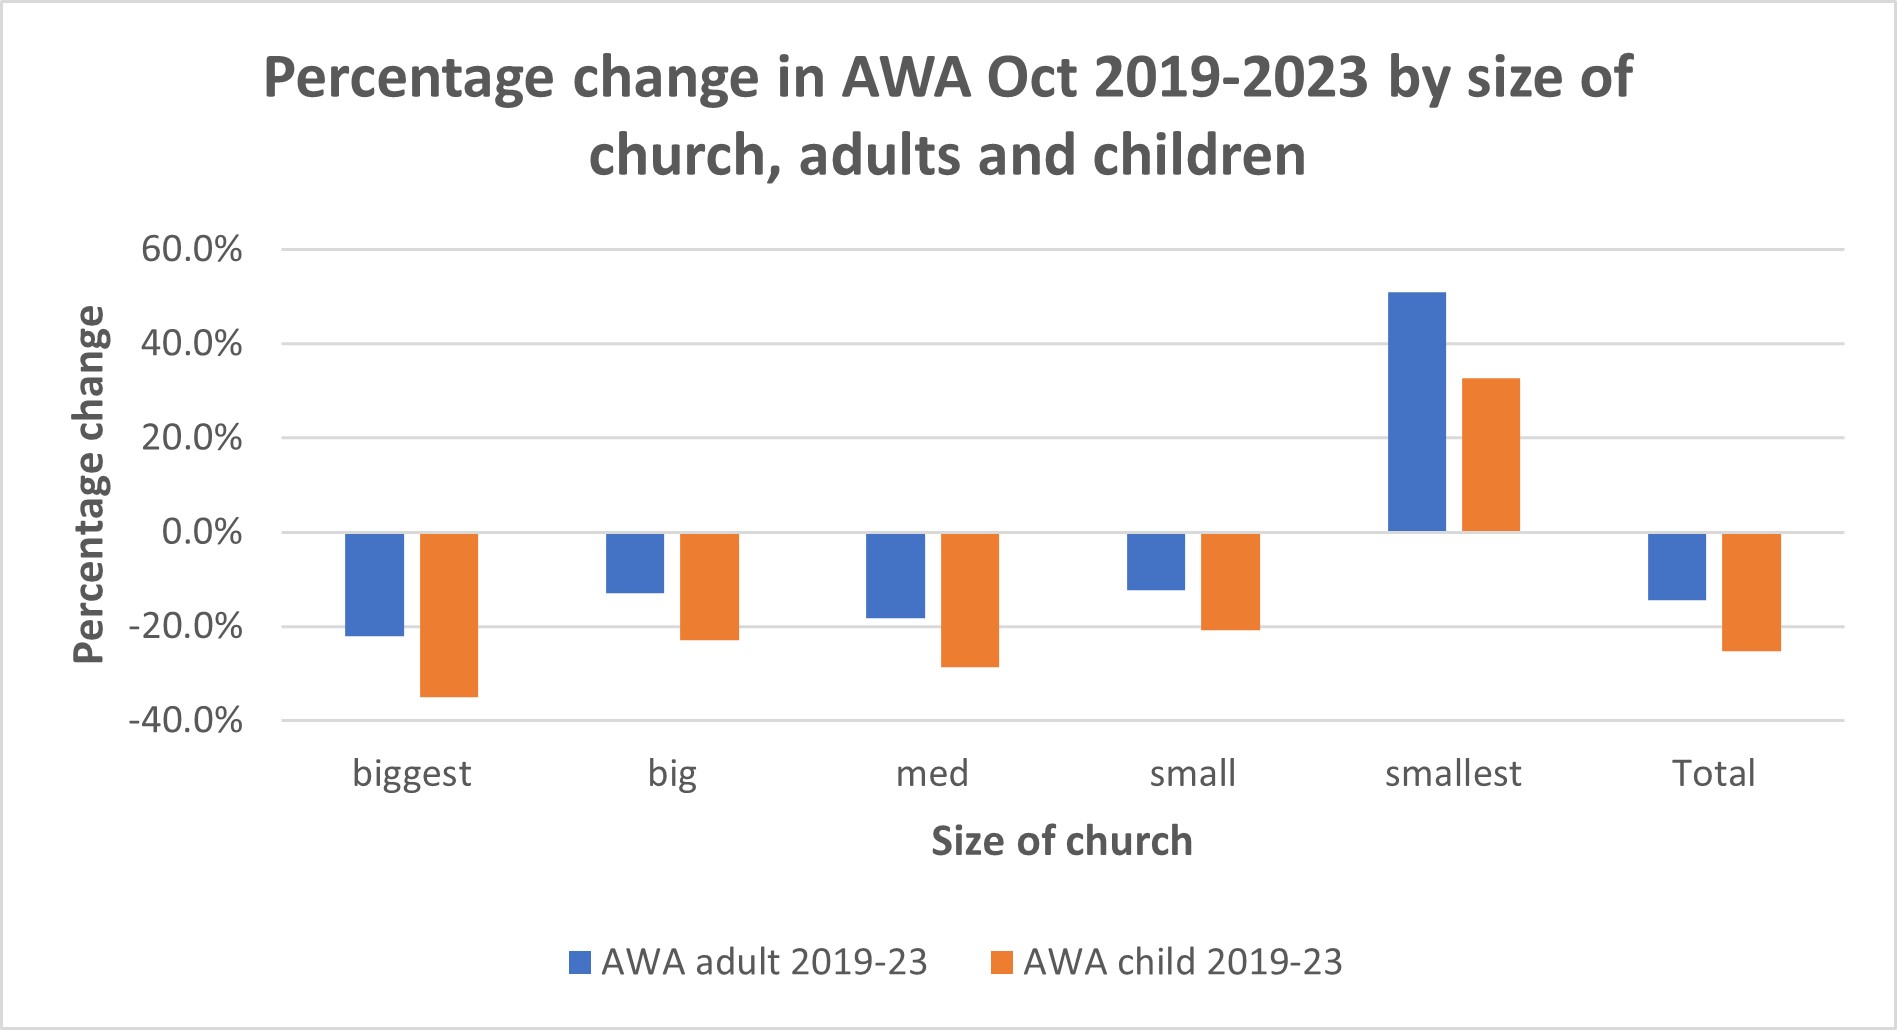
The recovery in AWA between 2022 and 2023 has been strongest among adults, with the AWA for adults increasing by 6.0% between 2022 and 2023, compared with an increase of 3.1% for children.
These differences between adults and children, with adult attendance showing a higher recovery are seen in the largest and smallest churches. In medium sized churches the increase between 2022 and 2023 was slightly higher for children. The big churches saw a small decrease in average AWA between 2022 and 2023 of 1.4% in adults and of 4.5% for children.

This suggests that recovery of ministry among children and families should continue to be a major priority in the diocese, and that resuming or starting child or family-friendly worship events and fresh expressions would be integral to this.
Change in number of services.
In the previous analysis last year, comparing 2019 October AWA with that in 2022, we saw that the decrease in AWA between the two years was associated with a similar fall in the number of Sunday services offered by churches. So, one explanation for the fall in AWA was that it is not that there were fewer people at each service – rather that the average number of adults at a Sunday service was the same as it was in 2019; the total might be down because there were fewer services.
The weakening of the recovery by size of church link was associated with a reduction in the number of services. The churches in October 2022 offered only 82% of the number of services they had in 2019. There were 15% fewer Sunday services, and 22% fewer weekday services.
Between 2022 and 2023 the number of services offered across the diocese did not change, still being at 82% of the 2019 number, so the increase in AWA between 2022 and 2023 is due to small increases in the average attendance at each service rather than in the number of services offered. This was seen in all sizes of church except the medium sized churches, as shown in the chart below. All other sized churches had recovered their average number of people attending in each service. The most plausible explanation for the 16% loss in AWA compared to 2019, therefore, is that there are fewer services.
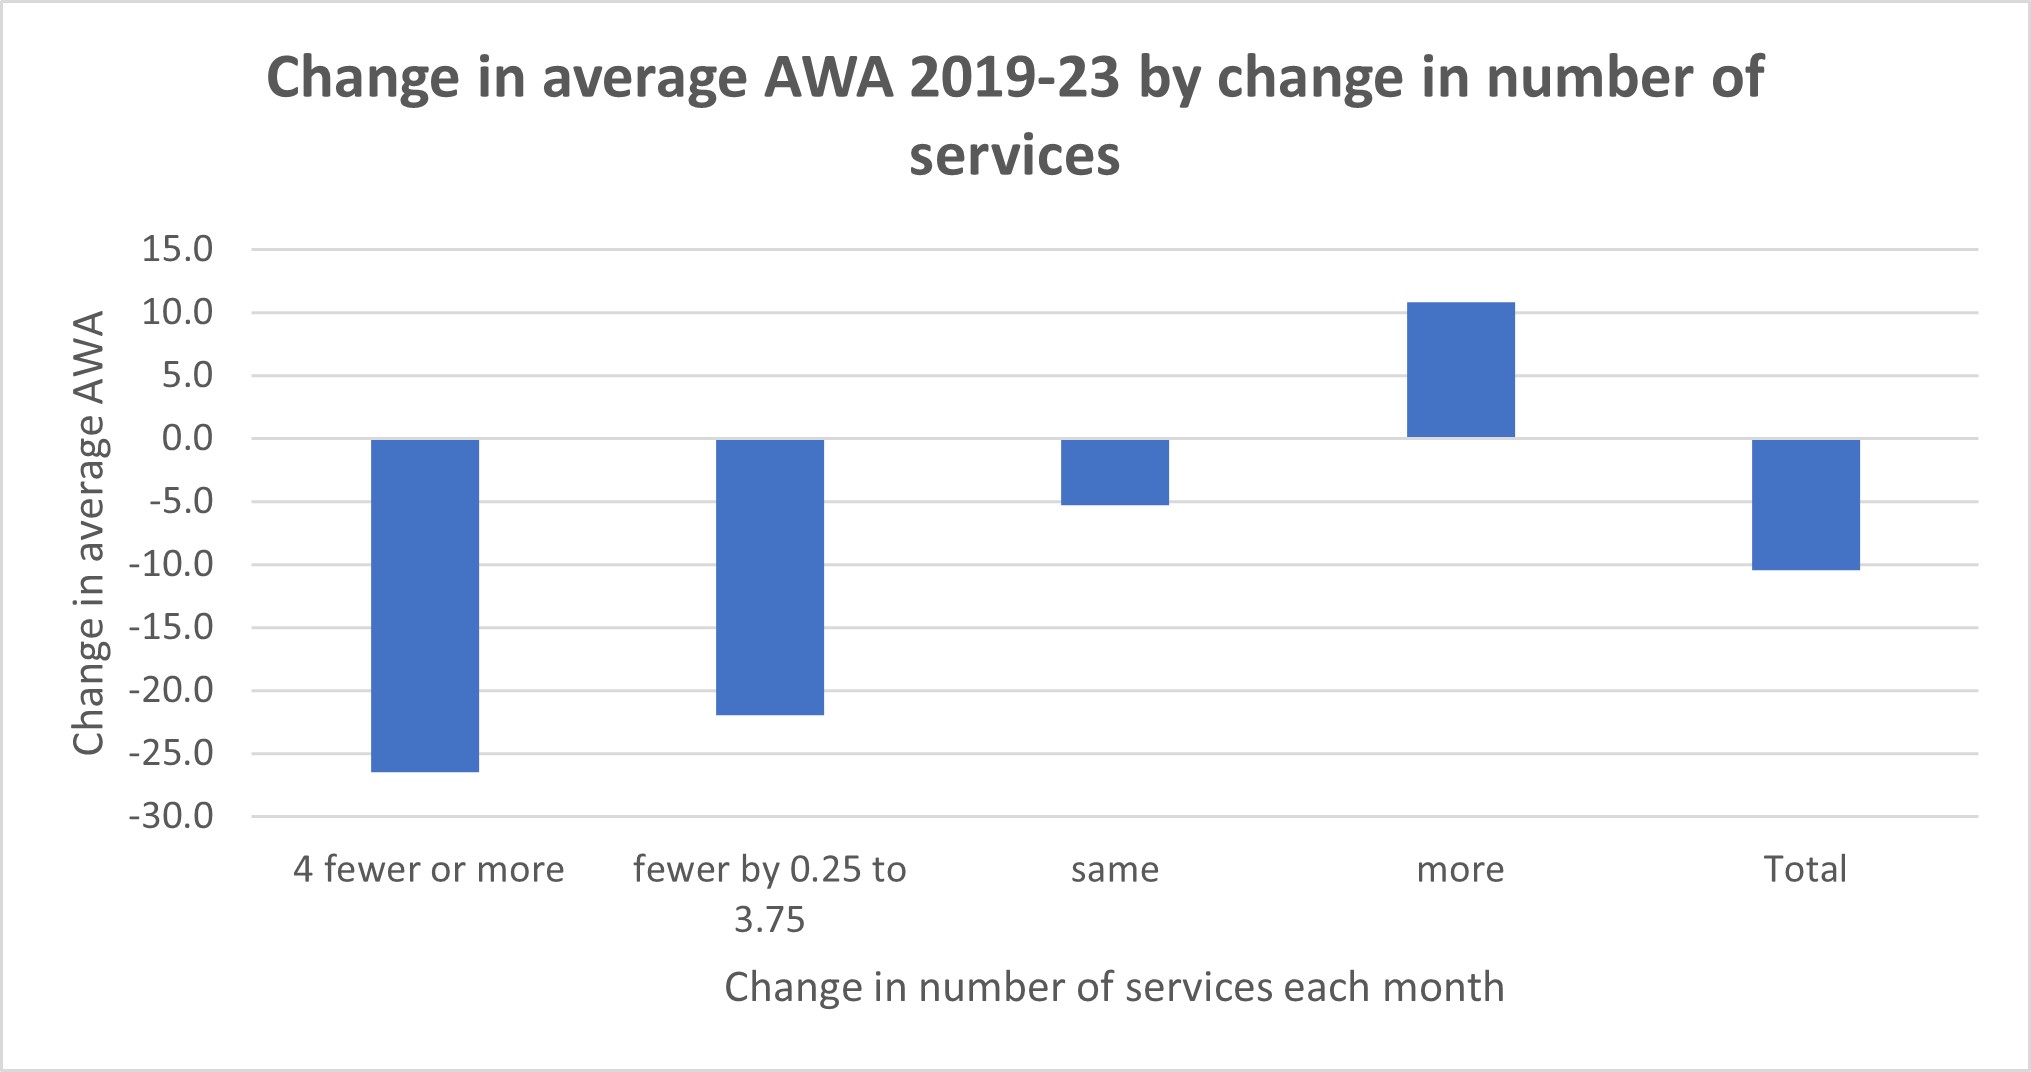
Where churches increased their number of services, they saw an increase in their AWA compared with 2019. For churches that introduced one or more extra services each month, their average AWA increased by 11, compared to those who have continued to offer the same number of services who saw a decrease of 5. Those that have stopped offering one or more services each month saw on average 23 fewer people in their congregation compared with 2019.
In October 2023, 32% of the churches in our sample no longer had at least one Sunday service every week compared with 29% in 2022 and 25% in 2019. Thirty-one percent of churches in our sample held one service each Sunday in October (the same as in 2022), and the remaining 36% held more than one service per week. Twenty percent of churches held two or more service on average each week, of which 74% were in the biggest churches group and the remainder in the big churches group.
The relationship between falling number of services and falling attendance is no surprise because people tend not to adjust their habits in response to lower service frequency. If people whose regular service is weekly tend to come once a fortnight, then they will most likely come once a month if their service moves to be fortnightly, and similarly those whose service changes to be monthly will come once every two months. That is why when the churches cut their weeks when they offer a Sunday service the average congregation size when there is a service remains about the same. In fact, if anything, it goes down a little as people are no longer sure which Sunday the service happens and may give up the first time, they turn up to find the door locked. It is especially hard for a congregation that does not meet weekly to attract and hold newcomers.
School services
School services were not originally included in our study, but we did have these data as part of the data collected during October. Average weekly all age attendance at school services in the churches in our sample was 31% higher in 2023 than it was in 2019. By and large, of course, the children have no option but to attend these services, but at least this shows it is possible to reach and exceed pre covid attendance levels in one category of churchgoing. However, we have less confidence that our sample represents the whole diocese with school services than with ordinary church services as attendance at school services varies considerably – 400 one week, zero the next etc.
7. Discussion and recommendations
Restart a service
It is likely that many churches and clergy emerged from the pandemic weakened and exhausted. They have only re-started what is within their capacity and they deserve sympathy and understanding. This may explain the reduction in numbers of services seen across our diocese up to 2022 and the lack of any further increase between 2022 and 2023.
The statistical evidence suggests that numbers grow when appropriate provision is made and shrink when it is withdrawn. This is true in relation to the number of weeks a month that churches are open, to the number of services offered.
It may be that the lack of recovery and smaller number of services post-covid has created the room needed for new services and expressions of church to be planted to replace those not re-started after covid. So, one recipe for future attendance growth in many churches is: Restart a service or replace it with a new congregation.
Invite people back
Alongside that it is also a good time to hold a ‘back to church invitation Sunday’, the congregation especially inviting those who have not yet resumed. These may have been the people who had been part of the congregation for services that the churches are no longer offering. It is also a fruitful time for enquirers courses like Alpha and Come and See. Invite those you have not yet seen back in church.